- Significant federal investments needed to address the shortage of 7.3 million affordable and available homes for the nation’s lowest-income renters
March 07, 2024
By NLIHC
Washington, D.C. – (Highpoint Digest) – In March 2023 the NLIHC its annual report, The Gap: A Shortage of Affordable Homes. The report finds a national shortage of 7.3 million affordable and available rental homes for extremely low-income renters – those with incomes at or below either the federal poverty line or 30% of their area median income (whichever is greater). Between 2019 and 2021, the shortage increased by more than 500,000 rental homes, as the number of renters with extremely low incomes increased and the supply of housing affordable to them decreased. The report calls for greater federal investments in the preservation and expansion of the affordable housing stock, more Housing Choice Vouchers, a national housing stabilization fund for renters who experience an unexpected short-term financial shock, and federal tenant protections.

“As this year’s Gap report makes clear, extremely low-income renters are facing a staggering shortage of affordable and available homes,” said NLIHC President and CEO Diane Yentel. “In the wake of the pandemic, federal housing investments are more critical than ever for sustaining our communities and helping low-income people thrive. Yet House Republicans are now threatening to cut funding for the very programs that provide a lifeline to low-income renters. Balancing the national budget must not be done on the backs of our nation’s lowest-income and most marginalized people and families.”
Every year, The Gap reports on the severe shortage of affordable rental homes available to extremely low-income families and individuals. The new Gap report finds that the economic repercussions of the COVID-19 pandemic, followed by significant rent increases, drastically impacted the supply of affordable and available rental homes, nationally, in recent years. As households lost income and rental prices increased, the number of extremely low-income households rose, while the number of units affordable to them shrank.
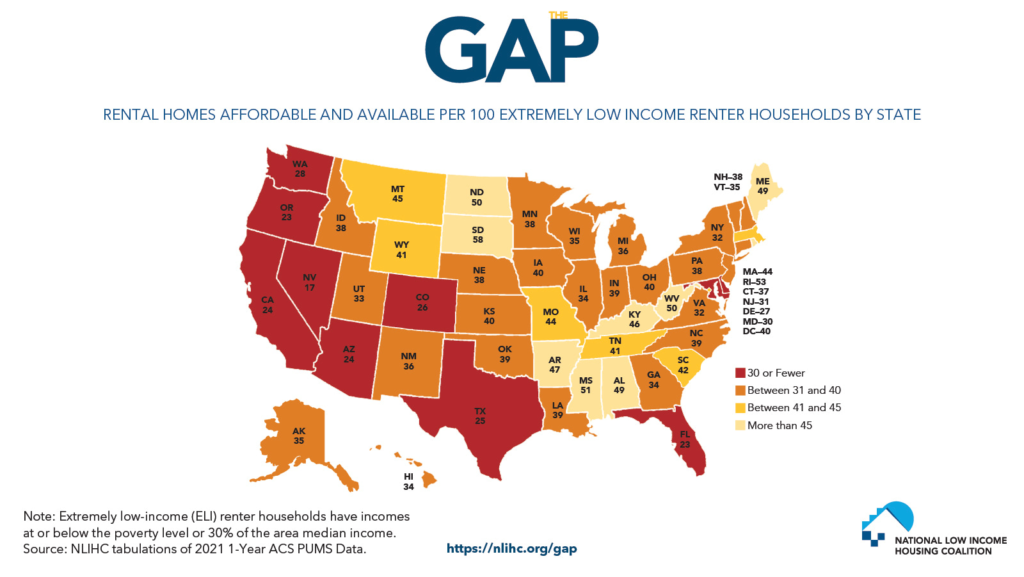
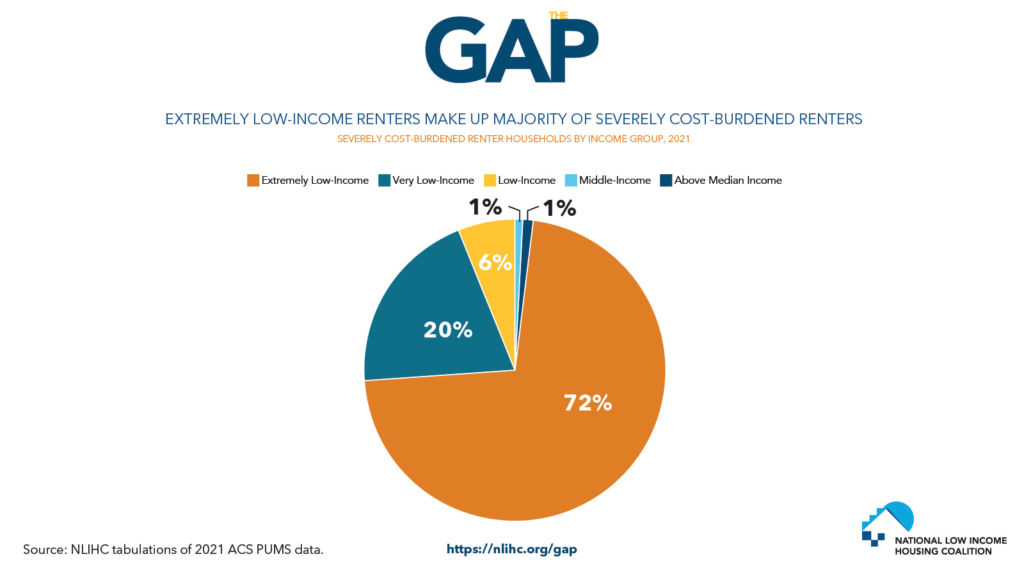
Just 33 affordable and available homes exist for every 100 renter households with extremely low incomes. This shortage impacts every state and the District of Columbia, resulting in widespread housing cost burdens. As a result of this shortage of affordable homes, 73% of extremely low-income renter households are severely housing cost-burdened, spending more than half of their limited incomes on housing. They account for more than seven of every 10 severely housing cost-burdened renters in the U.S.

The report finds that renters of color are more likely than white households to be renters with extremely low incomes and are more likely to be directly impacted by the lack of affordable rental housing. Nineteen percent of Black households, 17% of American Indian or Alaska Native households, 14% of Latino households, and 9% of Asian households are extremely low-income renters. Only 6% of white non-Latino households are extremely low-income renters.
The report also discusses the necessity of local zoning and land use reform to address the shortage of affordable rental housing. However, these efforts on their own, and without significant federal investments in housing assistance, are insufficient to correct the problem. The report argues for sustained investment by Congress in deeply income-targeted programs such as the national Housing Trust Fund, Housing Choice Vouchers, and public housing. As The Gap demonstrates, the housing crisis for the lowest-income renters will persist long after the pandemic without such investments.
| Alabama | 170,510 | 49 | 70% |
| Alaska | 20,291 | 35 | 69% |
| Arizona | 179,846 | 24 | 80% |
| Arkansas | 100,262 | 47 | 68% |
| California | 1,308,328 | 24 | 78% |
| Colorado | 168,752 | 26 | 78% |
| Connecticut | 142,367 | 37 | 68% |
| Delaware | 29,007 | 27 | 77% |
| District of Columbia | 54,624 | 40 | 73% |
| Florida | 575,379 | 23 | 83% |
| Georgia | 322,338 | 34 | 77% |
| Hawaii | 41,207 | 34 | 70% |
| Idaho | 39,722 | 38 | 66% |
| Illinois | 443,746 | 34 | 73% |
| Indiana | 199,050 | 39 | 70% |
| Iowa | 95,680 | 40 | 65% |
| Kansas | 92,717 | 40 | 71% |
| Kentucky | 165,116 | 46 | 67% |
| Louisiana | 187,331 | 39 | 71% |
| Maine | 44,256 | 49 | 52% |
| Maryland | 207,554 | 30 | 75% |
| Massachusetts | 313,607 | 44 | 64% |
| Michigan | 301,315 | 36 | 72% |
| Minnesota | 167,522 | 38 | 66% |
| Mississippi | 107,372 | 51 | 69% |
| Missouri | 204,049 | 44 | 69% |
| Montana | 28,632 | 45 | 65% |
| Nebraska | 65,077 | 38 | 66% |
| Nevada | 101,413 | 17 | 86% |
| New Hampshire | 32,677 | 38 | 62% |
| New Jersey | 323,284 | 31 | 74% |
| New Mexico | 67,899 | 36 | 73% |
| New York | 970,882 | 32 | 73% |
| North Carolina | 343,385 | 39 | 72% |
| North Dakota | 25,385 | 50 | 73% |
| Ohio | 447,717 | 40 | 68% |
| Oklahoma | 134,533 | 39 | 70% |
| Oregon | 141,795 | 23 | 80% |
| Pennsylvania | 430,703 | 38 | 69% |
| Rhode Island | 51,596 | 53 | 60% |
| South Carolina | 157,352 | 42 | 74% |
| South Dakota | 24,596 | 58 | 61% |
| Tennessee | 217,445 | 41 | 69% |
| Texas | 904,814 | 25 | 79% |
| Utah | 65,032 | 33 | 73% |
| Vermont | 21,784 | 35 | 73% |
| Virginia | 254,821 | 32 | 78% |
| Washington | 242,726 | 28 | 75% |
| West Virginia | 58,212 | 50 | 66% |
| Wisconsin | 195,642 | 35 | 69% |
| Wyoming | 17,417 |
Source: National Low Income Housing Coalition
Graphics provided by National Low Income Housing Coalition
Source: National Low Income Housing Coalition
Graphics courtesy of National Low Income Housing Coalition
Photos courtesy of Pexel/Binyamin Mellish


