April 24, 2024
By Highpoint Digest News Staff
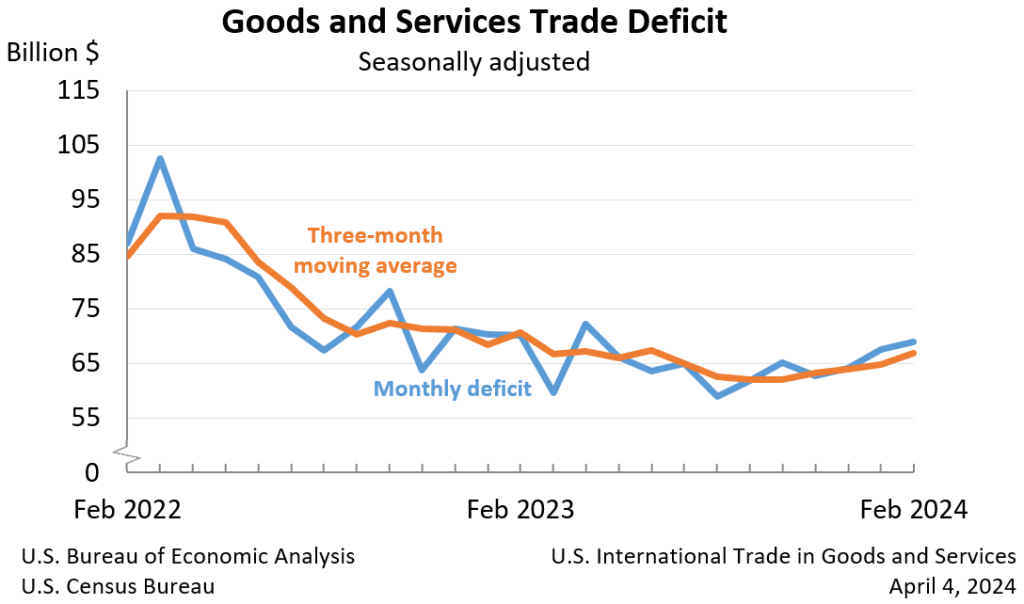
Washington, DC – (Highpoint Digest) – The U.S. Census Bureau and the U.S. Bureau of Economic Analysis announced that the goods and services deficit was $68.9 billion in February, up $1.3 billion from $67.6 billion in January.
U.S. International Trade in Goods and Services Deficit
| Deficit: | $68.9 Billion | +1.9%° |
| Exports: | $263.0 Billion | +2.3%° |
| Imports: | $331.9 Billion | +2.2%° |
| Next release: Thursday, May 2, 2024(°) Statistical significance is not applicable or not measurable. Data adjusted for seasonality but not price changesSource: U.S. Census Bureau, U.S. Bureau of Economic Analysis; U.S. International Trade in Goods and Services, April 4, 2024 | ||
Exports, Imports, and Balance (exhibit 1)
February exports were $263.0 billion, $5.8 billion more than January exports. February imports were $331.9 billion, $7.1 billion more than January imports.
The February increase in the goods and services deficit reflected a decrease in the goods deficit of $0.3 billion to $91.4 billion and a decrease in the services surplus of $1.6 billion to $22.5 billion.
Year-to-date, the goods and services deficit decreased $3.9 billion, or 2.8 percent, from the same period in 2023. Exports increased $9.3 billion or 1.8 percent. Imports increased $5.4 billion or 0.8 percent.
Three-Month Moving Averages (exhibit 2)
The average goods and services deficit increased $2.1 billion to $66.9 billion for the three months ending in February.
- Average exports increased $3.0 billion to $259.0 billion in February.
- Average imports increased $5.1 billion to $325.9 billion in February.
Year-over-year, the average goods and services deficit decreased $3.7 billion from the three months ending in February 2023.
- Average exports increased $5.3 billion from February 2023.
- Average imports increased $1.6 billion from February 2023.
Exports (exhibits 3, 6, and 7)
Exports of goods increased $5.0 billion to $176.7 billion in February.
Exports of goods on a Census basis increased $5.0 billion.
- Industrial supplies and materials increased $2.9 billion.
- Crude oil increased $1.1 billion.
- Nonmonetary gold increased $0.6 billion.
- Foods, feeds, and beverages increased $1.7 billion.
- Soybeans increased $1.0 billion.
- Capital goods increased $1.5 billion.
- Civilian aircraft increased $1.4 billion.
- Automotive vehicles, parts, and engines decreased $1.3 billion.
- Passenger cars decreased $0.9 billion.
Net balance of payments adjustments decreased less than $0.1 billion.
Exports of services increased $0.8 billion to $86.4 billion in February.
- Travel increased $0.4 billion.
- Transport increased $0.3 billion.
Imports (exhibits 4, 6, and 8)
Imports of goods increased $4.7 billion to $268.1 billion in February.
Imports of goods on a Census basis increased $4.8 billion.
- Consumer goods increased $1.6 billion.
- Cell phones and other household goods increased $1.4 billion.
- Pharmaceutical preparations decreased $1.3 billion.
- Foods, feeds, and beverages increased $1.3 billion.
- Other foods increased $0.5 billion.
- Automotive vehicles, parts, and engines increased $1.1 billion.
- Other automotive parts and accessories increased $0.5 billion.
Net balance of payments adjustments decreased less than $0.1 billion.
Imports of services increased $2.4 billion to $63.8 billion in February.
- Travel increased $1.3 billion.
- Transport increased $1.0 billion.
Real Goods in 2017 Dollars – Census Basis (exhibit 11)
The real goods deficit increased $1.0 billion, or 1.2 percent, to $87.0 billion in February, compared to a 0.3 percent decrease in the nominal deficit.
- Real exports of goods increased $3.0 billion, or 2.1 percent, to $147.8 billion, compared to a 2.9 percent increase in nominal exports.
- Real imports of goods increased $4.0 billion, or 1.7 percent, to $234.9 billion, compared to a 1.8 percent increase in nominal imports.
Revisions
Revisions to January exports
- Exports of goods were revised down $0.1 billion.
- Exports of services were revised up $0.1 billion.
Revisions to January imports
- Imports of goods were revised down less than $0.1 billion.
- Imports of services were revised up $0.2 billion.
Goods by Selected Countries and Areas: Monthly – Census Basis (exhibit 19)
The February figures show surpluses, in billions of dollars, with South and Central America ($5.5), Netherlands ($4.3), Hong Kong ($2.8), Australia ($1.6), United Kingdom ($0.8), Belgium ($0.6), Brazil ($0.6), Switzerland ($0.4), and Saudi Arabia (less than $0.1). Deficits were recorded, in billions of dollars, with China ($21.9), European Union ($17.6), Mexico ($15.3), Vietnam ($9.6), Germany ($7.6), Japan ($6.2), Ireland ($5.3), South Korea ($5.2), Canada ($5.1), India ($4.4), Taiwan ($4.2), Italy ($3.4), Malaysia ($2.4), France ($0.8), Singapore ($0.3), and Israel ($0.3).
- The balance with Switzerland shifted from a deficit of $1.5 billion in January to a surplus of $0.4 billion in February. Exports increased $0.7 billion to $3.6 billion and imports decreased $1.2 billion to $3.2 billion.
- The deficit with Japan decreased $1.1 billion to $6.2 billion in February. Exports increased $0.1 billion to $6.4 billion and imports decreased $1.0 billion to $12.6 billion.
- The deficit with Mexico increased $2.7 billion to $15.3 billion in February. Exports increased $0.4 billion to $27.6 billion and imports increased $3.1 billion to $43.0 billion.
Source: Bureau of Economic Analysis
Photo courtesy of the U.S. Customs and Border Protection