August 28, 2028
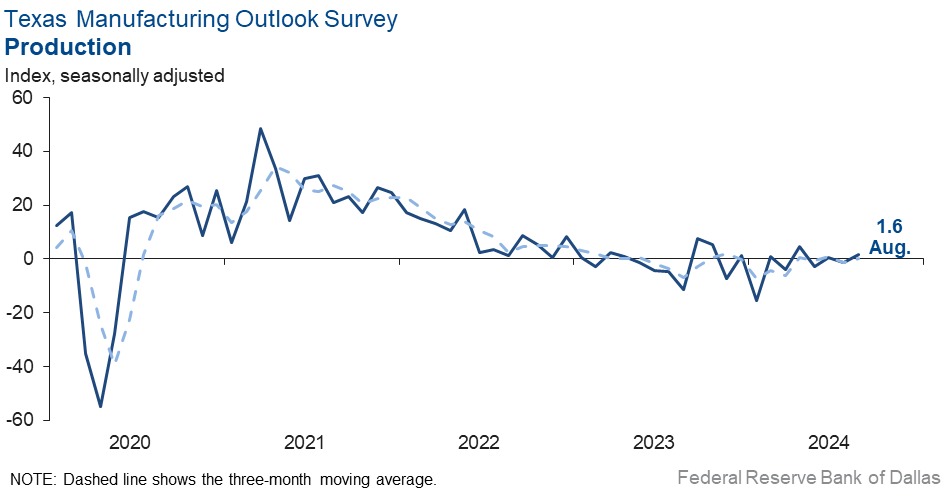
Dallas, TX (Highpoint Digest) − Texas factory activity exhibited little growth in August, according to business executives responding to the Texas Manufacturing Outlook Survey. The production index, a key measure of state manufacturing conditions, inched up three points to 1.6, with the low reading signaling only slight growth in output from July.
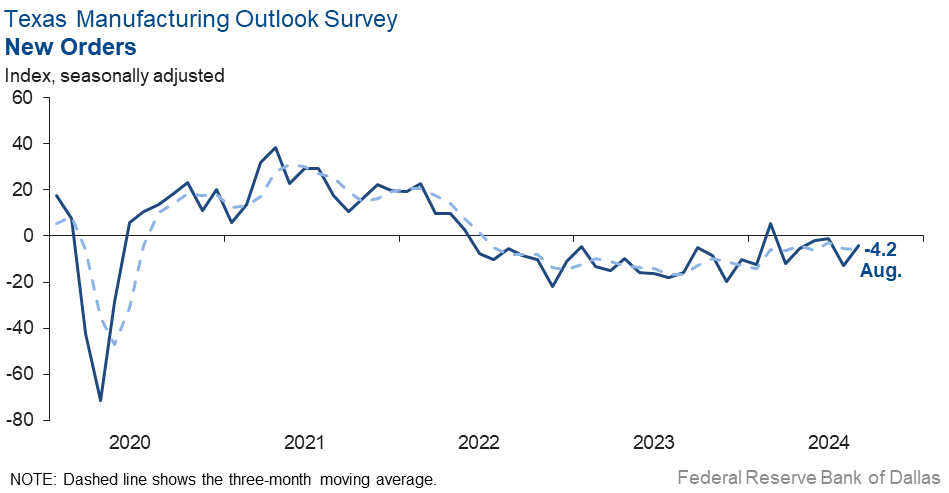
Most other measures of manufacturing activity continued to indicate declines this month, though they were less negative than in July. The new orders index climbed nine points to -4.2, and the capacity utilization index pushed up eight points to -2.5. The shipments index came in near zero, rebounding from -16.3 last month.
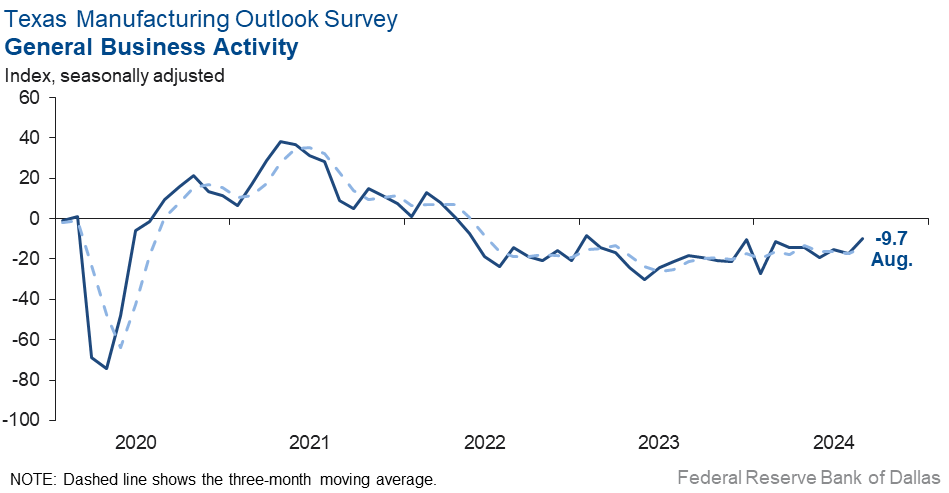
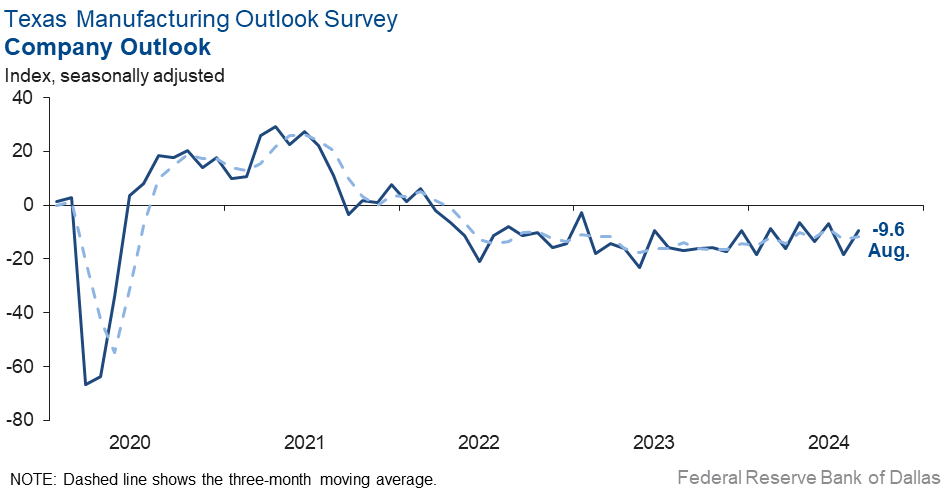
Perceptions of broader business conditions remained negative but were less pessimistic in August. The general business activity index rose eight points to -9.7, and the company outlook index rose nine points to -9.6. The outlook uncertainty index fell notably after spiking last month, retreating 23 points to 7.5.
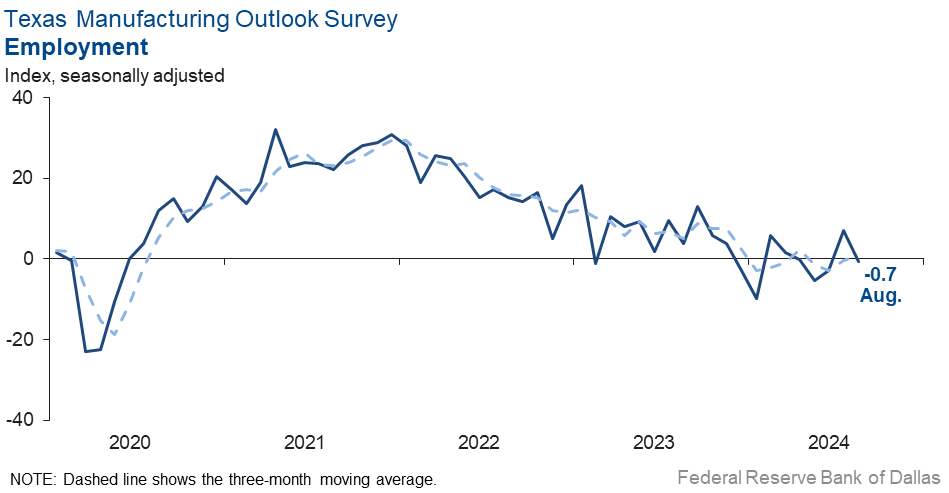
Labor market measures suggested flat employment and slightly shorter workweeks this month. The employment index slipped to -0.7, with the near-zero reading indicating no change in employment levels from July when the index spiked to a 10-month high. Sixteen percent of firms noted net hiring, while 17 percent noted net layoffs. The hours worked index remained negative but moved up to -2.6 from -13.8.
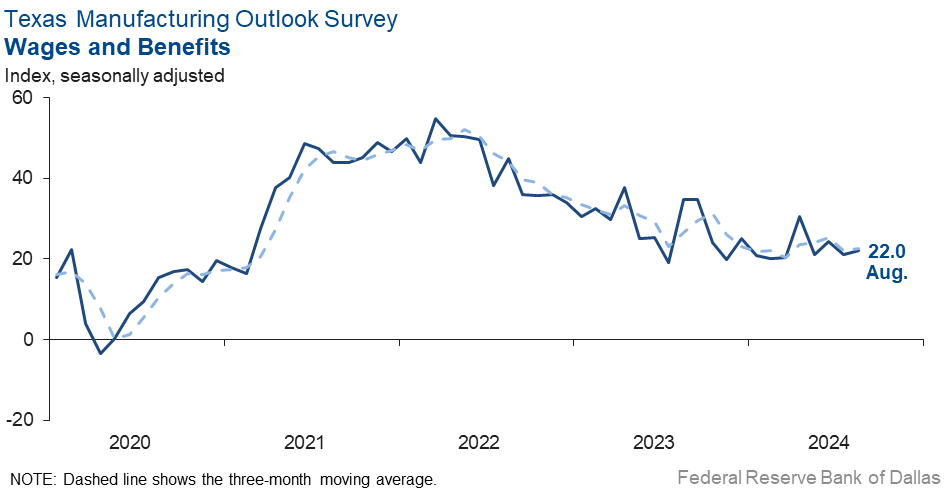
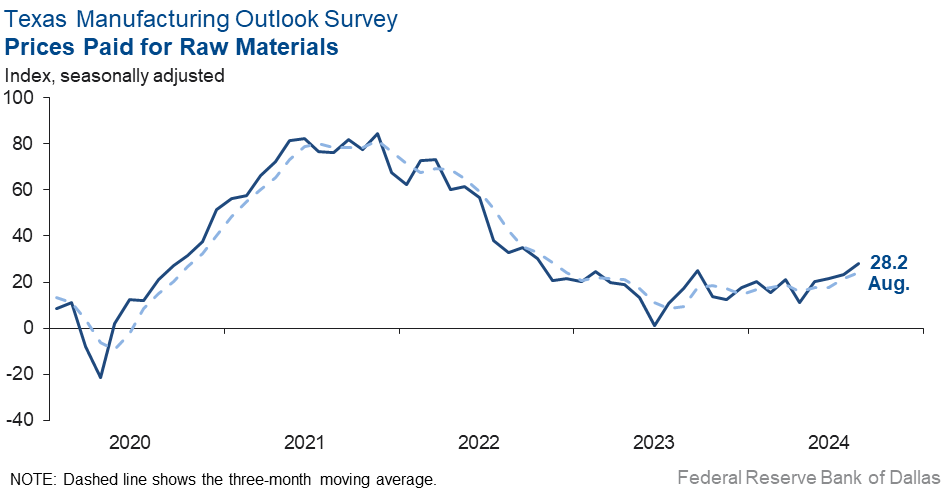
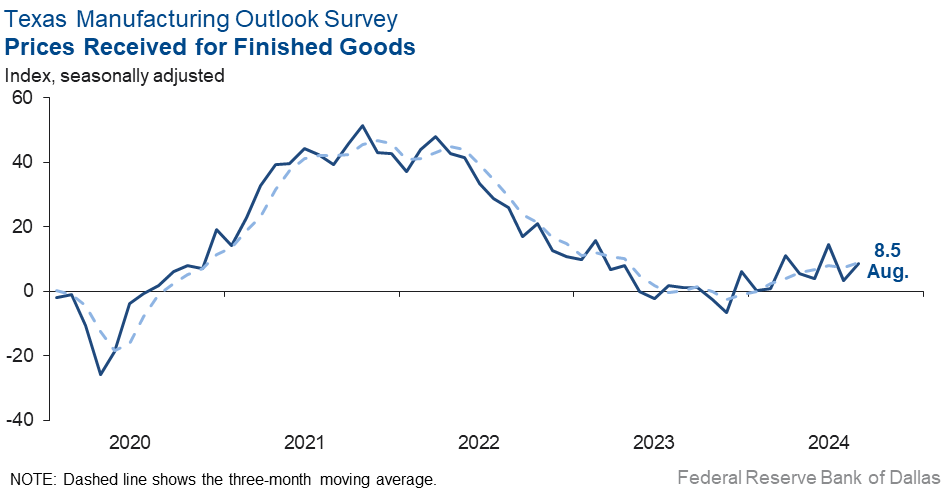
Moderate upward pressure on prices and wages continued in August. The wages and benefits index held steady at 22.0, a reading in line with the historical average. The raw materials prices and finished goods prices indexes both pushed up five points, coming in at 28.2 and 8.5, respectively.
Expectations regarding future manufacturing activity remained positive but showed mixed movements this month. The future production index inched up to 33.7, while the future general business activity retreated 10 points to 11.6.
Data were collected Aug. 13–21, and 83 of the 125 Texas manufacturers surveyed submitted a response. The Dallas Fed conducts the Texas Manufacturing Outlook Survey monthly to obtain a timely assessment of the state’s factory activity. Firms are asked whether output, employment, orders, prices and other indicators increased, decreased or remained unchanged over the previous month.
Survey responses are used to calculate an index for each indicator. Each index is calculated by subtracting the percentage of respondents reporting a decrease from the percentage reporting an increase. When the share of firms reporting an increase exceeds the share reporting a decrease, the index will be greater than zero, suggesting the indicator has increased over the prior month. If the share of firms reporting a decrease exceeds the share reporting an increase, the index will be below zero, suggesting the indicator has decreased over the prior month. An index will be zero when the number of firms reporting an increase is equal to the number of firms reporting a decrease. Data have been seasonally adjusted as necessary.
Result Tables
Historical data are available from June 2004 to the most current release month.
| Business Indicators Relating to Facilities and Products in Texas Current (versus previous month) |
||||||||
| Indicator | Aug Index | Jul Index | Change | Series Average |
Trend* | % Reporting Increase | % Reporting No Change | % Reporting Decrease |
| Production | 1.6 | –1.3 | +2.9 | 9.8 | 1(+) | 25.5 | 50.6 | 23.9 |
| Capacity Utilization | –2.5 | –10.0 | +7.5 | 7.7 | 4(–) | 22.1 | 53.3 | 24.6 |
| New Orders | –4.2 | –12.8 | +8.6 | 5.1 | 6(–) | 23.3 | 49.2 | 27.5 |
| Growth Rate of Orders | –5.1 | –16.6 | +11.5 | –0.7 | 4(–) | 18.7 | 57.5 | 23.8 |
| Unfilled Orders | 1.0 | –26.6 | +27.6 | –2.2 | 1(+) | 16.7 | 67.6 | 15.7 |
| Shipments | 0.8 | –16.3 | +17.1 | 8.1 | 1(+) | 25.2 | 50.4 | 24.4 |
| Delivery Time | –1.0 | –5.3 | +4.3 | 0.9 | 17(–) | 9.7 | 79.6 | 10.7 |
| Finished Goods Inventories | 6.1 | –5.0 | +11.1 | –3.1 | 1(+) | 22.0 | 62.2 | 15.9 |
| Prices Paid for Raw Materials | 28.2 | 23.1 | +5.1 | 27.2 | 52(+) | 32.9 | 62.4 | 4.7 |
| Prices Received for Finished Goods | 8.5 | 3.4 | +5.1 | 8.6 | 9(+) | 16.0 | 76.5 | 7.5 |
| Wages and Benefits | 22.0 | 21.2 | +0.8 | 21.2 | 52(+) | 22.7 | 76.6 | 0.7 |
| Employment | –0.7 | 7.1 | –7.8 | 7.5 | 1(–) | 15.8 | 67.7 | 16.5 |
| Hours Worked | –2.6 | –13.8 | +11.2 | 3.2 | 11(–) | 10.9 | 75.6 | 13.5 |
| Capital Expenditures | 15.7 | 0.8 | +14.9 | 6.6 | 11(+) | 25.9 | 63.9 | 10.2 |
|
General Business Conditions |
||||||||
| Indicator | Aug Index | Jul Index | Change | Series Average |
Trend** | % Reporting Improved | % Reporting No Change | % Reporting Worsened |
| Company Outlook | –9.6 | –18.4 | +8.8 | 4.4 | 30(–) | 14.8 | 60.8 | 24.4 |
| General Business Activity | –9.7 | –17.5 | +7.8 | 0.7 | 28(–) | 16.5 | 57.3 | 26.2 |
| Indicator | Aug Index | Jul Index | Change | Series Average |
Trend* | % Reporting Increase | % Reporting No Change | % Reporting Decrease |
| Outlook Uncertainty | 7.5 | 30.7 | –23.2 | 17.1 | 40(+) | 22.5 | 62.5 | 15.0 |
|
Business Indicators Relating to Facilities and Products in Texas |
||||||||
| Indicator | Aug Index | Jul Index | Change | Series Average |
Trend* | % Reporting Increase | % Reporting No Change | % Reporting Decrease |
| Production | 33.7 | 32.0 | +1.7 | 36.2 | 52(+) | 41.1 | 51.5 | 7.4 |
| Capacity Utilization | 32.9 | 21.4 | +11.5 | 33.1 | 52(+) | 39.0 | 54.9 | 6.1 |
| New Orders | 30.7 | 30.3 | +0.4 | 33.6 | 22(+) | 39.2 | 52.3 | 8.5 |
| Growth Rate of Orders | 17.7 | 19.3 | –1.6 | 24.8 | 15(+) | 25.2 | 67.3 | 7.5 |
| Unfilled Orders | 7.0 | –2.6 | +9.6 | 2.8 | 1(+) | 12.1 | 82.8 | 5.1 |
| Shipments | 30.1 | 29.1 | +1.0 | 34.7 | 52(+) | 37.4 | 55.3 | 7.3 |
| Delivery Time | 4.5 | 4.6 | –0.1 | –1.4 | 2(+) | 10.6 | 83.3 | 6.1 |
| Finished Goods Inventories | 3.9 | –6.9 | +10.8 | 0.0 | 1(+) | 15.4 | 73.1 | 11.5 |
| Prices Paid for Raw Materials | 25.2 | 28.5 | –3.3 | 33.4 | 53(+) | 32.2 | 60.8 | 7.0 |
| Prices Received for Finished Goods | 21.2 | 23.0 | –1.8 | 20.8 | 52(+) | 25.0 | 71.3 | 3.8 |
| Wages and Benefits | 38.1 | 39.2 | –1.1 | 39.2 | 243(+) | 39.4 | 59.3 | 1.3 |
| Employment | 22.0 | 18.7 | +3.3 | 22.8 | 51(+) | 28.0 | 66.0 | 6.0 |
| Hours Worked | 9.2 | 8.8 | +0.4 | 8.8 | 5(+) | 13.8 | 81.6 | 4.6 |
| Capital Expenditures | 20.0 | 22.4 | –2.4 | 19.4 | 51(+) | 27.8 | 64.4 | 7.8 |
|
General Business Conditions |
||||||||
| Indicator | Aug Index | Jul Index | Change | Series Average |
Trend** | % Reporting Increase | % Reporting No Change | % Reporting Worsened |
| Company Outlook | 18.5 | 22.0 | –3.5 | 18.3 | 9(+) | 26.5 | 65.5 | 8.0 |
| General Business Activity | 11.6 | 21.6 | –10.0 | 12.2 | 3(+) | 27.3 | 57.0 | 15.7 |
*Shown is the number of consecutive months of expansion or contraction in the underlying indicator. Expansion is indicated by a positive index reading and denoted by a (+) in the table. Contraction is indicated by a negative index reading and denoted by a (–) in the table.
**Shown is the number of consecutive months of improvement or worsening in the underlying indicator. Improvement is indicated by a positive index reading and denoted by a (+) in the table. Worsening is indicated by a negative index reading and denoted by a (–) in the table.
Charts